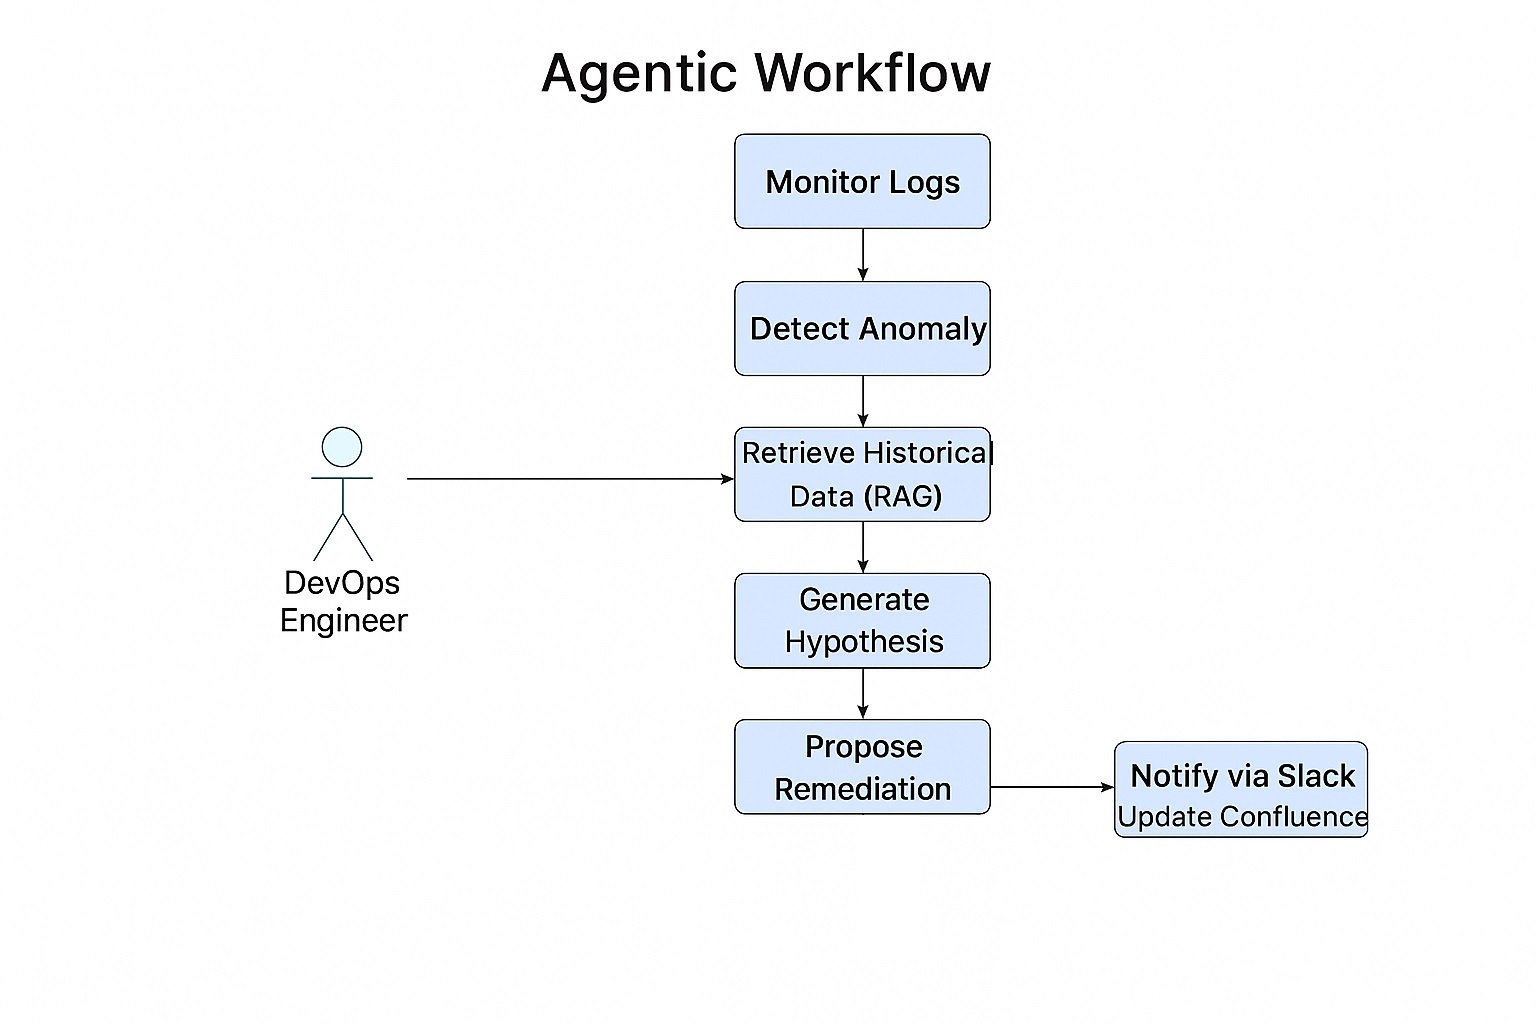
Observability stack
Capture the signals you rely on—logs, metrics, traces, events—and how they flow through your tooling. Clarify ownership and alert routing.

Golden signals
Service health
- Latency, traffic, error rate, saturation.
- Business KPIs that indicate customer impact.
- Dependencies and external SLA monitoring.
Actionable alerts
- Route to the teams that can fix the issue.
- Include runbook links, recent deployments, and suspected dependencies.
- Auto-silence noisy alerts and track MTTR trends.
Incident review
Close the loop with structured reviews that focus on learning instead of blame.

Feed these learnings into your
Resilience Engineering playbook to harden recovery patterns.